These are the terms you need to know to talk intelligently about conversion rate optimization.
Conversion
Conversion is the visitor action you’re hoping to improve with the campaign (e.g., registering for a webinar, adding a product to the shopping cart, etc.).
Be aware, you must define your conversion actions. Clearly identify what you’re testing, what you’re aiming for, and the metric that matters most in measuring your results.
Control
Control is the page in the experiment that does not receive the treatment. In conversion testing, the control is the version of the page that currently converts best. Any new variation is tested against the control.
So in an A/B test, the control is A. Your test version, or variation (see below), is B.=
Variation
Variation is the page in the experiment that has received the treatment you’re testing. For example, the variation page might have a shorter lead form than the control page.
TIP: Name your variants in the test so it’s easy to identify the key element in each. Something like this:
- Control – full form
- Variant 1 – shortened form
- Variant 2 – email only
- Variant 3 – form + survey
Quantitative Data
This is any data that can be measured numerically. The “number stuff,” such as:
- Unique visits
- Sign-ups
- Purchases
- Order value
- Qualitative Data
- This is the descriptive data. The “people stuff” that’s more difficult to analyze but often gives context to your quantitative data. This would include:
- Heatmaps
- Session recordings
- Form analytics
Conversion Rate
This is calculated by dividing the number of conversion (whatever you defined) by the total number of visitors to the page you’re testing.

Lift Percentage
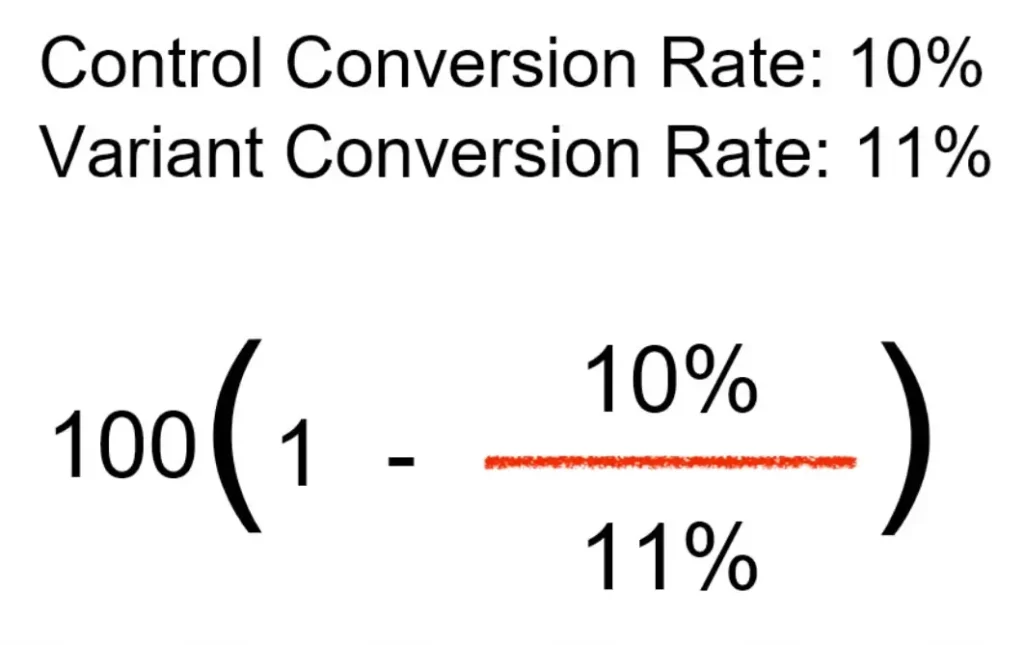
The percentage change between two variants (not the difference between the two numbers). To calculate lift percentage, use this formula:

In this case, while the difference is 1%, the lift percentage is 10%.
Confidence Rate
Technically speaking, this is: “The percentage of instances that a set of similarly constructed tests will capture the true mean (accuracy) of the system being tested within a specified range of values around the measured accuracy value of each test.”
In layman’s terms, you’re trying to avoid false positives. So the confidence rate shows how sure you are that your test is accurate.
For instance, let’s say your confidence rate is 95%. That would indicate that if you were to run the campaign 100 times, 95 of the tests would show your variant a winner. A common mistake is to interpret this as the “odds” of you getting your same results. As if a 95% confidence rate meant there’s a 95% chance you’ll get the same results from another test. We’re not talking odds. We’re calculating the accuracy. In every test, you’ll see slight differences. Confidence rate indicates you’ll see difference but not the degree of difference.
Conversion Range
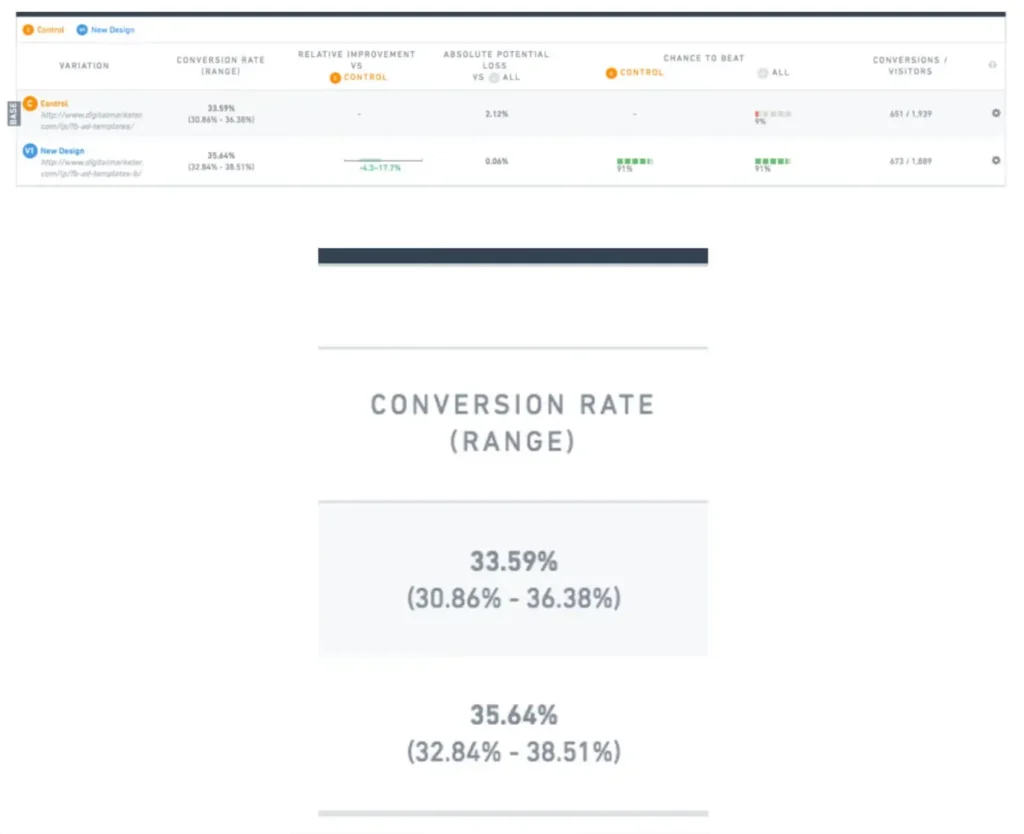
“Conversion rate” is a misnomer. It makes it sound like your tests will give you one precise number that you can call the “conversion rate.” In reality, expect to see conversions within a range—not as a precise number. So 30.86% to 36.38%, with 33.59 as the mean.

Notice that the two tests overlap slightly. The goal is to break the overlap, so your winning variant is a clear winner.
References:
Digital Marketer. (n.d.). The Ultimate Guide to Digital Marketing. Course Hero. Retrieved January 25, 2022, from https://www.coursehero.com/file/94978188/Ultimate-Guide-to-Digital-Marketingpdf/

