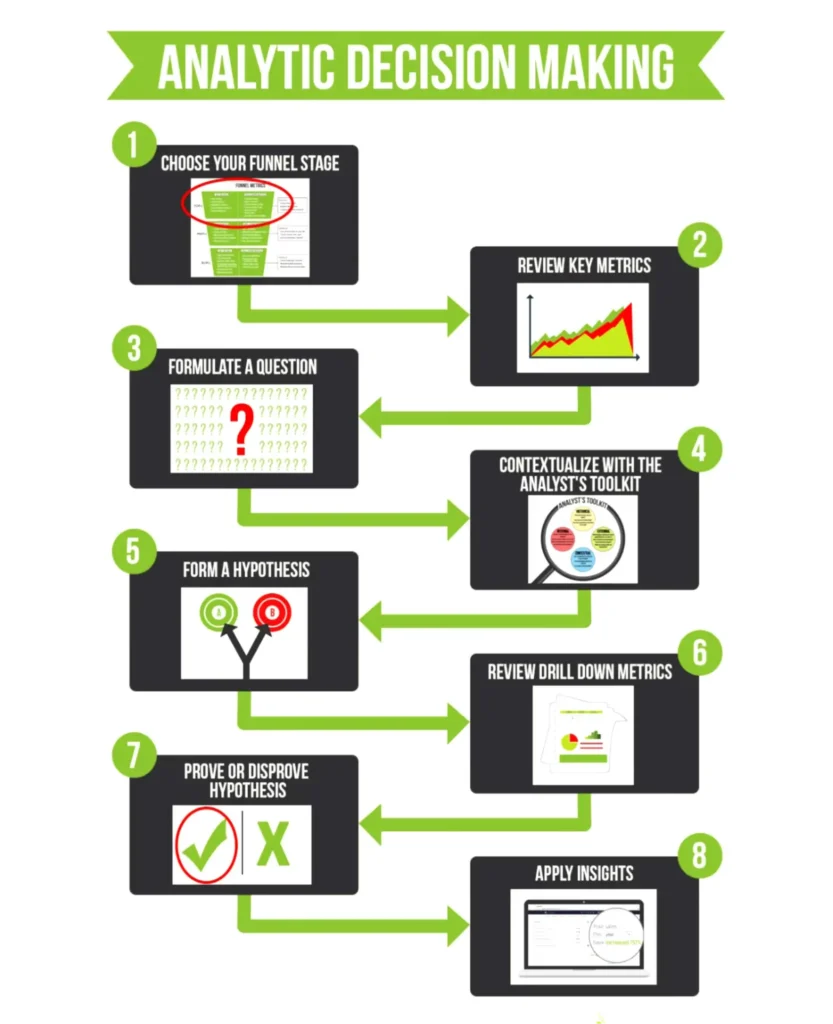
Data is collected on a dashboard, right? But on the dashboard, it’s raw data. Your job is to turn raw data into active data. For that, you use the analytic decision-making process:

This process works a lot like the scientific method, except it’s based on metrics. It’s the same with data and analytics. You review your data and start asking questions about it. You make hypotheses about what might happen if you could impact any of those numbers. And then you devise a test to see if you’re right.
Simply by reviewing the results, you can clearly see what needs to be done to improve your business. Making decisions is no longer about your gut instincts, but about what the data is telling you. That’s the theory, anyway.
But in practice, we often don’t know enough to know what questions we should be asking. In those situations, it often helps to take another data dive. In the scientific method, you start with questions and hypotheses, and then you make predictions about what might happen if you test different hypotheses.
Reviewing Key Metrics to Inspire Questions
When you don’t know enough to know what you should be asking, your metrics will often give you the insight you need.
Step 1. Start by Reviewing your Key Metrics.
Identify the places where your performance is better than expected or, perhaps, trending downward. In many cases, this will inspire questions. This blog post’s traffic is double most other blog posts. What made it perform better? We’re getting new subscribers every day, but our total subscriptions are staying the same. What’s happening? Where are we losing subscribers? Why?
Step 2. Generate a Hypothesis About What’s Happening.
Make some predictions about what’s going on. For our Member’s Added inconsistency, we made three guesses: The $1 trial is a better offer because it converts more visitors for all traffic sources. The $1 trial churn is higher than that of full-pay members, meaning it doesn’t contribute to our goal of growing the lab. People keep restarting the $1 trial offer after their time expires, inflating conversion percentages. Hint: Don’t settle for just one hypothesis. It’s best to consider multiple explanations—ideally 5 to 7 hypotheses—and test them all. Otherwise you limit your ability to learn what’s going on.
You see, in most cases, there isn’t just one reason for the issue you’re seeing. Several factors may contribute to the success or failure you want to understand. The more hypotheses you have, the better your chances of isolating all the factors involved.
Step 3. Use Drill-down Metrics to Test Hypotheses.
For this, you’ll use more detailed, granular data to figure out what’s causing the issue you’re trying to understand. This data isn’t usually reviewed on a daily basis, but it exists, and you know where to find it. It’s also the data that helps you answer these kinds of questions.
For this particular question, we used cohort analyses to test our 3 hypotheses. We developed 7 cohorts, or different ways you could group the people, including cancellation date, average percentage paid, how long they were active, and more. After reviewing all that information, we realized that the $1 trial was a better front-end offer than the full-pay offer.
Step 4. Take Action Based on your Findings.
The conclusion of our data analysis was that the trial offer generates more paying customers than average. For every 100 people we put, 21 came from the trial, while 20 came from the full-pay offer. While that’s not a significant difference, over time, it can add up. So we changed our front-end offer. The $1 trial offer is now our primary offer, and so far, it’s yielded an extra 1,000 members.
References:
Digital Marketer. (n.d.). The Ultimate Guide to Digital Marketing. Course Hero. Retrieved January 25, 2022, from https://www.coursehero.com/file/94978188/Ultimate-Guide-to-Digital-Marketingpdf/

